Wildlife in the City
A digital visualization group project


A digital visualization group project
Humans aren’t the only beings that inhabit cities. From coyotes on rooftops in New York City to leopards in the alleys of Mumbai, we share our urban environments with a diverse range of animals. While it may be a nuisance to have racoons knock over your garbage or squirrels steal your lunch, many animals are of great value to cities.
We must also acknowledge the impacts of rapid urbanization on animal habitat loss and fragmentation. We have a responsibility to welcome animals into our urban spaces and design cities that are in harmony with nature. Such efforts are mutually beneficial, as the presence of green space and its accompanying wildlife has been found to enhance our psychological wellbeing.
This work aims to remind its viewers of our wild urban neighbours. Being reminded of the presence of wildlife in urban spaces can encourage us to better integrate the natural and built environments, and preserve biodiversity. This work includes stories from a variety of scales, locations, and time periods, showing how different animals inhabit urban environments all over the world. Throughout this work, we will look at the following four case studies:
 Urbanization and habitats
 Fishers in Albany
 Reptiles in London
 Bird in Los Angeles
Critical habitats (CH) can broadly be understood as areas with high biodiversity value that are relied upon by critically endangered or endangered species. Urbanization in the map is defined as the percentage of built up area in that cell. Overlaying these layers allows us to globally compare how processes of urbanization are in tension or in harmony with the preservation of the natural world. Below, we briefly compare the trends in three countries.
Most habitats including likely CH and potential CH are distributed at west and north west of China. It can be seen that high urbanization cities are located at middle and east of China, and these areas are far away or surrounding by habitat.
'Clear waters and green mountains are as good as mountains of gold and silver' said by president Xi. Government restricts the land development in habitats, and many industries have to be moved to other areas.
During the urbanisation from 1950 to 2017, Nanchang developed the urban area in the south part of the city. The habitat at north-west of the city is Panyang Lake, and Nanchang’s developed the urban area in the opposite direction to the habitat.
The habitats in UK are located at north of England and Scotland. Different from China, cities with low and middle urbanization are inside of habitats.
For instance, in Southampton and Bristol, there are some area with 5%-20% urbanization index inside of habitats. By contrast, some big cities like London and Birmingham are still far aways from habits, which is similar to China.
Likely CH is widely distributed at west part of the USA, while potential CH is at East of the USA. Compared with China and UK, some cities with high urbanization are inside of habitat.
In the west part of the USA, some big cities San Francisco and Los Angeles are surrounding by likely CH. In the south part, New orleans and Nashville are inside of likely and potential CH.
The possible reason leading to the difference among these three counties is urbanization time. The urbanization of China begin from reform and opening in the 1980s which is much later than UK and the USA. In this case, China can choose cities area far away from habitats. However, UK and the USA urbanization is earlier than China, and government in that time may not realise that. Meanwhile, these cities in the west of the USA are developed during Westward Movement (1800s-1900s), the cities were built sense easy to develop some industries in that time.
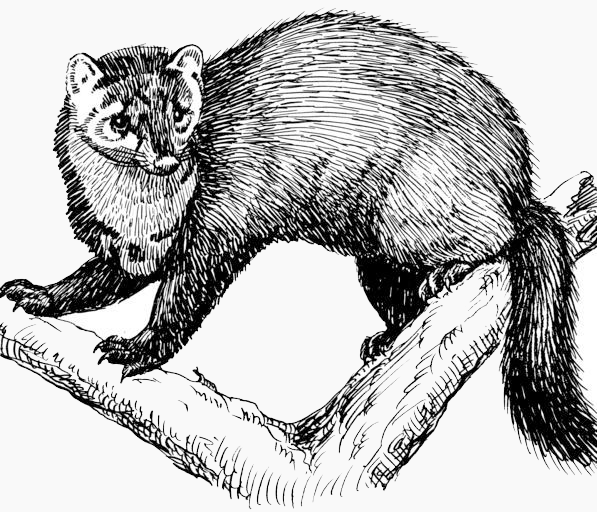
A weasel-like mammal, fishers commonly live in coniferous habitats throughout Canada and the northern United States. As described by Nature Conservancy Canada, habitat loss and fur trapping in the 19th and 20th centuries significantly reduced their range. Today, in the northeast US, fishers are experiencing a resurgence and are adapting to life in urban environments. This data, collected as part of a study on corridor-based movement models, provides insight into the daily behaviours of fishers and how they interact with the built environment.
We see the movement patterns from three fishers in the winter of 2011. Each fisher has its own habitat range, each of which cover a patchwork of urban green space. Movement is significantly bounded by major roadways, such as the New York State Thruway and the Adirondack Northway. We also see that the fishers are primarily mobile at night. Their movement patterns can largely be characterized by short clusters of localized movement and long-range movement across their habitat range. This insight can be useful in ensuring that new developments in Albany do not encroach on the habitats of these fishers, and can help researchers better understand how the fishers are adapting to life alongside humans.
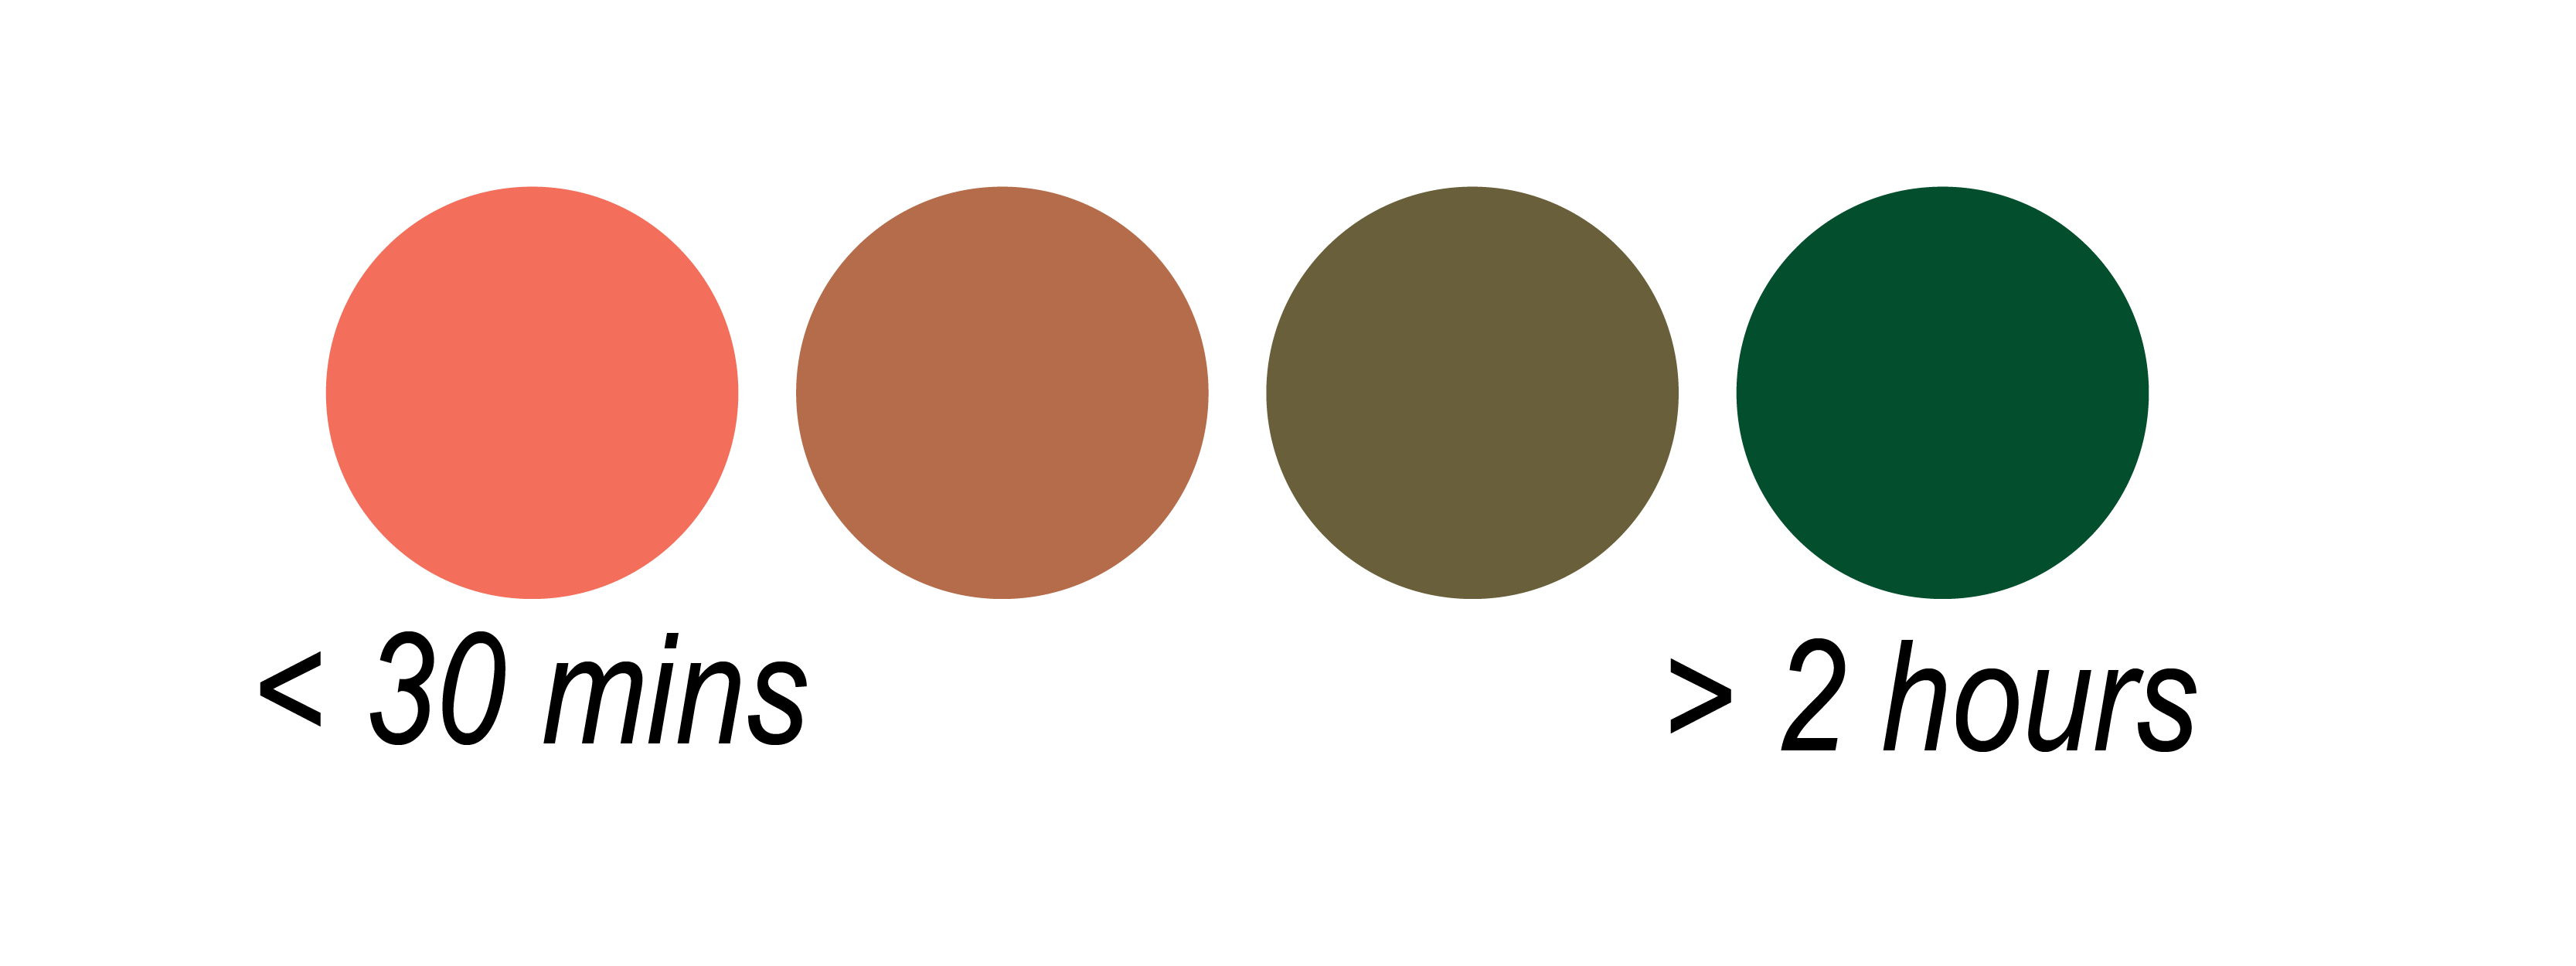
During the animation, the circular points correspond to the GPS point measurements in the original dataset. The lines connecting these points have been interpolated. The colour of these points indicate the time passed since the previous measurement.
Reptiles exist today as animals such as the turtles, crocodilians, snakes, amphibeans, lizards, tuatara, and including extinct non-avian dinosaurs. Today, the study of reptiles is referred to as herpetology, which combines the modern amphibians and traditional reptile. As the Amphibian and Reptile Conservation mentioned, reptiles populations declined in the UK during the 20th century because the destruction, degradation and fragmentation of habitats by humans. Reptile has the limited dispersal abilities especially the many habitats isolated now. Therefore, reptiles are vulnerable to habitat loss or degradation of habitats. This data, collected by the National Amphibian and Reptile Recording Scheme and Amphibian and Reptile Conservation in NBN Atlas websites, indicates locations of reptile observations from 1904 to 2014.
In this map, we can see the location of the reptiles from 1904 to 2014. The user can drag the time slider to explore the changing of location over year. Secondly,the user can select one of reptile type to explore the distibution.
Birds are one of the most frequent of urban wildlife encountered by people. But with the rapid urban expansion, many bird species have suffered significant population decline due to landscapes change and habitat loss. According to Audubon, more than 600 bird species that have been spotted in California make up about two-thirds of all birds species in North America. And Los Angeles leads all U.S. counties in nationwide bird count.
The map centered in Los Angeles, and the green area represent parks and open spaces. This visualization map includes two parts. The first is the heat map of observed birds data. The heat map color depends on data density, areas of concentration where many points are clustered closely together were painted in purple and the marginal area were painted in green. And the map contains two filters. The first filter is bird species, and the second filter is season, users can choose two filters together to present specifics bird species’ heat map in summer or in winter. The second part is the point map of dead birds. Red points represent dead birds, and orange points represent bird-window collision which lead to birds death.
Globally, urbanization levels and critical habitat distribution varies from country to country. Urbanization over time often occurs in close proximity to critical habitats. Throughout all visualizations in this work, we see the impacts that urbanization is having on animals. Reptiles in London have gradually moved further from the city center, and the movement fishers in Albany is constrained by major roadways. Our case studies also demonstrate the importance of parks and green space in cities, as they function as habitats for some birds in LA, reptiles on London, and fishers in Albany.
In our efforts to improve our quality of life in cities, we have immensely altered natural landscapes all over the world, creating pressures on wildlife. As is demonstrated in this project, we must remember that our “Living Cities” are made up of both humans and wildlife. When building cities, planners and designers must consider not only human well-being, but also the well-being of the animals who live alongside us.
This project was developed by Hannah Ker, Yu Fu, Jingwen Huang, and Wanzhi Xie as part of an assignment for a CASA digital visualization course. This website was built using a template adapted from StartBootstrap. Maps are powered by Mapbox, with the Cali Terrain styling. Icons are from the designers Iconixar, Freepik, and Monkik sourced from Flaticon. All photos are licensed for free use.
Urbanization data is from the History Database of the Global Environment and critical habitats data is from the Global Critical Habitat Screening Layer.
The movement data from fishers in Albany was accessed from Movebank and was originally collected as part of the following study: LaPoint, S, Gallery P, Wikelski M, Kays R (2013) Animal behavior, cost-based corridor models, and real corridors. Landscape Ecology, v 28 i 8, p 1615–1630. doi:10.1007/s10980-013-9910-0. This data can be accessed from this online repository.
Data on reptile observations on London is from the NBN Atlas.
Bird observation and bird death data from Los Angeles is from the iNaturalist website.